A townhouse development on sandy silt in Brampton's northwest corner got held up for three weeks last fall because the preliminary soil report assumed a low plasticity clay. The contractor had already poured strip footings when the first cracks appeared in the garage slabs. Our lab pulled the samples and ran a full Atterberg suite: the liquid limit came back at 48, and the plasticity index hit 22—numbers that the original design hadn't accounted for. That scenario repeats across Peel Region more often than anyone likes to admit, and it always points back to the same gap: skipping proper Atterberg limits testing early in the geotechnical investigation. When we pair these results with a grain-size analysis from the same Shelby tube, the soil classification snaps into focus and the structural team can adjust bearing capacity assumptions before concrete goes in the ground.
A plasticity index above 20 in Brampton's glaciolacustrine clays signals moderate to high swell potential—data that directly governs foundation depth and subgrade preparation.
How we work
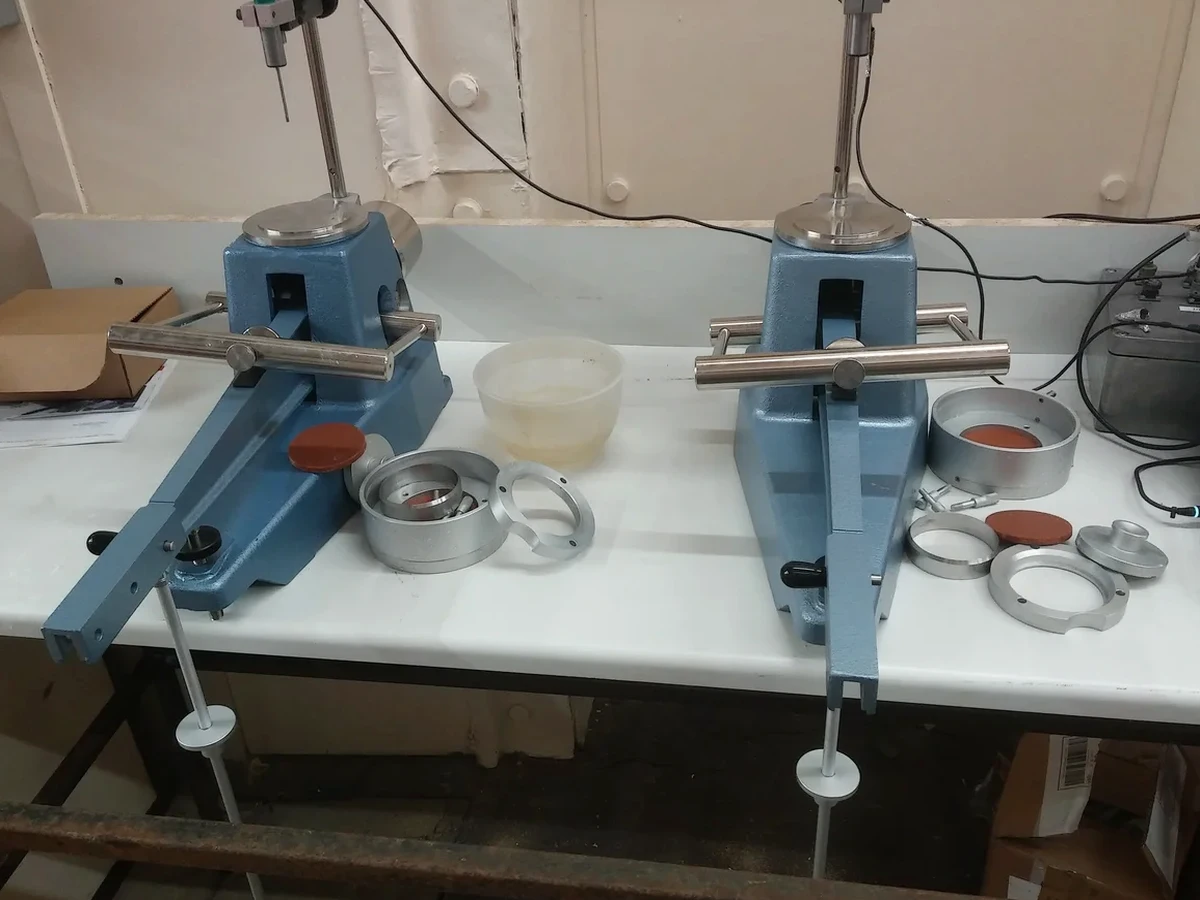
The Halton Till that underlies much of Brampton tells a specific story in the laboratory. Our technicians see it in the brass cup and the glass plate every week: silty clay matrices with liquid limits ranging from 35 to 55, plastic limits clustering between 15 and 22, and plasticity indices that push fine-grained soils into the CH or CL-ML zones on the Casagrande chart. The Atterberg limits test at our facility follows ASTM D4318-17e1 to the letter—multi-point liquid limit determination using a calibrated Casagrande percussion device, plastic limit thread rolling at 3.2 mm diameter, and oven drying at 110±5°C. Repeatability matters. We run duplicate determinations on every tenth sample and maintain control charts for the standard reference soil from the CCRL proficiency program. For Brampton's glaciolacustrine deposits, the natural water content often sits within 2–3% of the plastic limit, which means the soil is preconsolidated but sensitive to remolding—a fact that excavation contractors learn the hard way when they overwork the subgrade after a rain event. The plasticity index alone doesn't close the classification; we cross-reference it with the percent passing the No. 200 sieve to confirm whether a material truly behaves as a fat clay or a lean clay with silt.
Common questions
How much does Atterberg limits testing cost for a Brampton project?
Why do the Atterberg limits matter for foundation design in Brampton?
The plasticity index directly correlates with shrink-swell potential, and Brampton sits on glaciolacustrine clays that can exhibit PI values above 20. A PI above 20 signals moderate to high swell-shrink behavior, which governs the required depth of footings below the frost line and influences the decision between a conventional spread footing and a stiffened raft. Without Atterberg data, the geotechnical engineer cannot reliably classify the soil per the Unified Soil Classification System, and the structural design proceeds on assumptions rather than measured properties.
What's the difference between single-point and multi-point liquid limit testing?
Single-point methods estimate the liquid limit from one blow count using a correlation equation, and they work reasonably well for routine quality control when the soil type is already known. Multi-point testing—running the Casagrande cup at three or more water contents spanning a range of blow counts—produces a flow curve from which the liquid limit is interpolated at 25 blows. For Brampton's glacially derived silts and clays, which often plot near the A-line boundary, the multi-point method reduces classification uncertainty and is what ASTM D4318 specifies as Method A.
How long does the Atterberg limits test take from sample receipt to report?
Standard turnaround is five business days. The workflow includes oven-drying the specimen, pulverizing and sieving through the No. 40 sieve, hydrating to the appropriate consistency range, running the multi-point liquid limit with a minimum of three data points, performing the plastic limit thread-rolling procedure, and completing a second oven-drying cycle to determine final moisture contents. Expedited 48-hour reporting is available when the construction schedule demands it, and we coordinate directly with the drilling crew to receive samples the same day they're extracted.